Wind Resource Mapping
Resource grids let you manage a rectangular set of points for which summary predicted wind climate data are calculated. The points are regularly spaced and are arranged into rows and columns. This lets you see a pattern of wind climate or wind resources for an area. You don't need to create each point in the grid individually. Instead you just specify the location of the grid, the number of rows and columns and the distance between the points.
Here's an example:
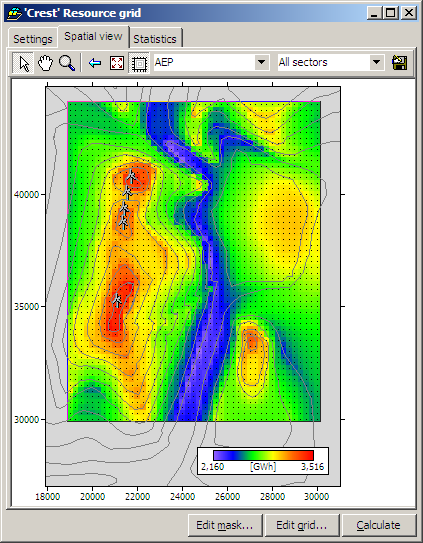
Each point in the grid is like a simpler version of a normal turbine site. All the points have the same height a.g.l. If a wind turbine generator is associated with the grid, then that specification is used for all of the points in the grid.
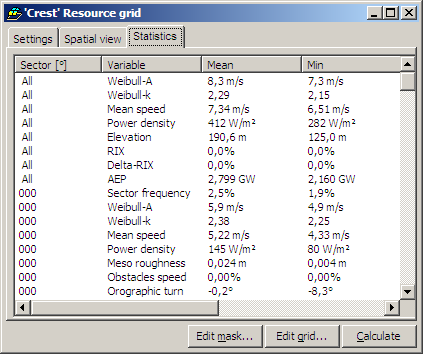
For each point, WAsP calculates the following data:
- the elevation
- the mean wind speed
- the mean power density
- the annual energy production (if a wind turbine generator is associated)
- the Weibull-A value
- the Weibull-k value
- the ruggedness index RIX
- the performance indicator DRIX
You can also see some simple statistics about the resource grid: