The latest version of the WAsP CFD result viewer facilitates IEC 61400-1 site assessment.
An optimal windfarm layout must utilize the available wind resource efficiently, minimize installation costs and ensure that turbine sites comply with the site assessment defined by the IEC 612400-1 standard. Siting engineers often perform site assessment individually for each turbine site in the wind farm layout, maybe even a few times as part of an iterative optimization process. A better strategy might be first to identify IEC-compliant areas, and then optimize the wind farm within a constrained area.
The main purpose of the WAsP CFD result viewer is to examine the flow and turbulence fields calculated by WAsP CFD. This information is displayed as 2D fields, vertical and horizontal profiles, directional variation at a select point and flow correction from one point to another.
In addition, the WAsP CFD result viewer now supports map-based site assessment by a combination of WAsP CFD results, wind climates by other WAsP software and turbine data including the IEC wind turbine class. This enables us to map site assessment parameters like wind shear, flow inclination angle, extreme wind speed, mean wind speed, mean wind probability, effective turbulence intensity, power density and gross annual energy production. We can also mask areas, which according to the IEC standard has non-compliant wind conditions - see Figure 1 - and display site assessment details for a selected site - see Figure 2.
The IEC site assessment includes an assessment of terrain complexity. This assessment is based on planes fitted to specific areas around each turbine site, in particular the slopes of the fitted planes and the variation between terrain and fitted planes. The WAsP CFD result viewer can map this terrain complexity - see Figure 3.
Watch these videos for a demonstration and download the latest version of the WAsP 12 bundle. Other new features in WAsP 12 are direct download of mean wind climates from the Global Wind Atlas and site-dependent temperature lapse rates for automatic air-density prediction.
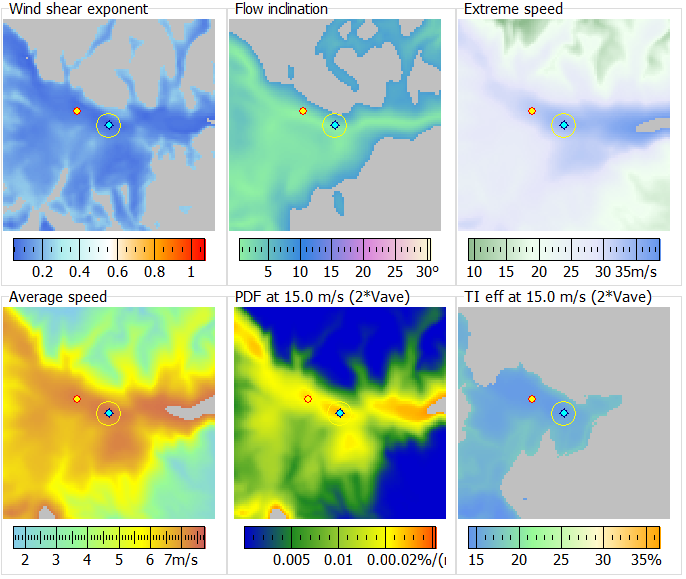
Figure 1: Maps of site assessment parameters where non-compliant areas are masked.
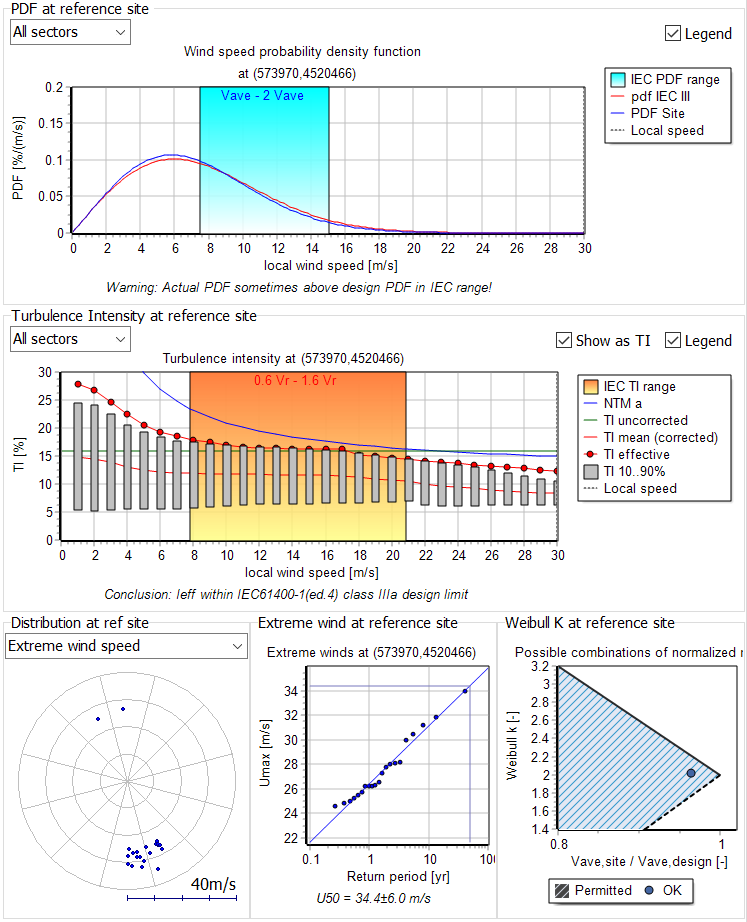
Figure 2: Site assessment for a selected site
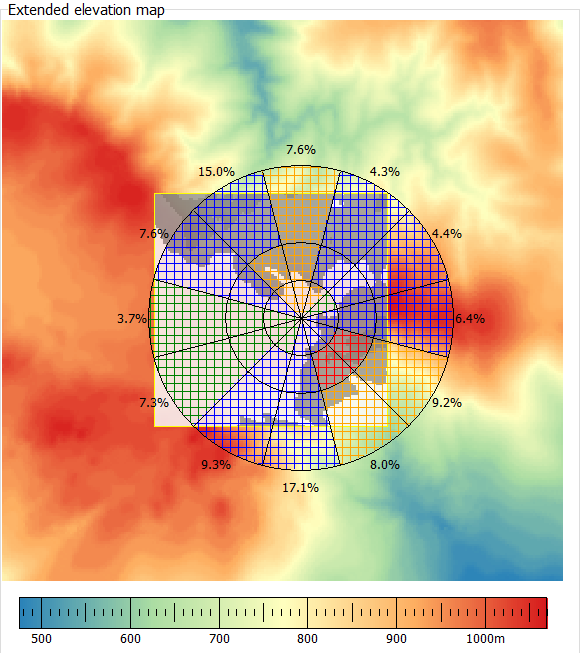
Figure 3: Terrain elevation map with overlay of IEC terrain complexity map